
What Wins on Streaming: The CTV Creative Performance Report
Vibe Intelligence – August 2026
What actually drives visits and sales on streaming — from 4.9 billion Vibe.co impressions, 3,400+ brands, and 17,000+ creatives over 90 days, backed by the industry's biggest effectiveness research.
Key Takeaways
- Creative = 49% of sales impact. More than audience, reach, and recency combined. Marketers think it's 19%.
- 15s returns more per dollar: 4.3× vs 2.9×. The edge is efficiency, not persuasion. Within a single advertiser, longer creative converts slightly better.
- 3 seconds to hook. Face or problem in the first frame. Build for a muted room — half of viewing is sound-off.
- 80% say a bad ad is worse than none. And they blame the brand. On a 65-inch screen, weak creative is a guaranteed liability.
- One message, warm. 40% are likelier to buy from brands running sequential creative than the same spot on repeat.
- AI ads: +62% site visits, though the advertiser mix behind that number is unresolved. The durable case isn't better ads, it's more shots on goal. Test, cut losers, find the winner fast.
- QR converts. Wispr Flow hit 20%. Ask for exactly one action, and make it impossible to miss.
For a decade, marketing poured its energy into targeting and measurement. Reach the right person. Prove what happened afterward. On streaming, those problems are largely solved — you can reach exactly the household you want, and you can trace what they did next.
Which surfaces a more uncomfortable question: if the infrastructure is handled, what's actually moving the number?
The answer is the part most teams have been treating as a formality. Across more than 450 sales-effect studies, NCSolutions and Nielsen found that creative drives 49% of advertising's impact on sales — more than audience, reach, and recency combined. The same marketers estimate it's worth 19%. That's not a small miscalibration. It's the biggest lever in the plan, and most teams are barely touching it.
On connected TV the stakes are especially high. The ad plays on a 65-inch screen, can't be scrolled past, and runs to completion 90–98% of the time. A weak creative isn't just inefficient — it delivers a guaranteed, full-screen bad experience, and viewers blame the brand.
But get it right and the same guaranteed attention works hard in your favor. What "right" looks like on streaming is specific: short, warm, clear, and built for a muted room.
Short means shorter than most teams default to — we'll get into the specifics when we show you the data. Warm means a real person or a relatable problem in the first frame, not a product shot over music. Clear means one message your viewer could repeat back after half-paying attention. Built for a muted room means bold text carrying the message and a visual story that makes sense with the sound off — because roughly half the time, it is.
So we went looking for specifics. Not "creative matters," but which choices actually move visits, purchases, and return — from 4.9 billion impressions on Vibe, every ad tied to a real outcome. The most counterintuitive finding involves the ads you didn't make.
Go shorter, but know what you're selling
This is the clearest pattern in our platform data, and also the one that took the most work to interpret correctly.
Across roughly 17,000 active ads and 4.9 billion impressions, 15-second spots drove 44% more site visits and about 1.5× the return of 30-second spots. The gap only closes on direct purchases, where 30-second ads slightly edge out Push past a minute and performance falls off a cliff.
Before you act on that number, it's worth asking whether it's really about ad length. Brands that favor 15-second spots might just be better at converting. Tighter funnels, warmer audiences, stronger offers. If that's what's driving the 44%, the credit belongs to those advertisers, not to the format.
Ad length isn't a random choice. It tracks with what a brand sells and how people buy it. A $12 impulse product has no reason to run 30 seconds, the whole pitch fits in six. A $2,000 purchase with a six-week decision cycle usually needs the extra time to explain itself. Those two businesses also convert at completely different rates on a per-impression visit metric, for reasons that have nothing to do with creative. So a platform-wide comparison of 15s against 30s is partly a comparison of impulse categories against considered ones. Some of the 44% is ad length. Some of it is the kind of business that reaches for 15 seconds in the first place.
So we ran it a different way. Instead of comparing short ads to long ads across the whole platform, our ML team compared advertisers to themselves: same brand, same audience, one 15-second spot and one 30. Asked that way, the answer flips. The 30 converts slightly better, by around 7%.
So we tested it directly. Our ML team added creative duration to the conversion model as an isolated feature, then hid it from the model three-quarters of the time during training. That forces the advertiser signal to carry the baseline and leaves duration to explain only what remains. The result reversed the pooled read: holding the advertiser constant, longer creative converted slightly better on both site visits and purchases, worth roughly 7% in conversion odds for a 15-second to 30-second swap.
“Across the whole platform, shorter ads look better. But that's mostly about which advertisers run short ads, not about length. When we compared brands against themselves, the effect pointed the other way. It's small, and I'd call it directional. But it's the opposite of what the raw numbers say.”
Both numbers are real. They answer different questions. Conversion rate asks whether the ad persuaded someone. Return on ad spend asks what that cost you. 15-second inventory is cheaper, which is where the 4.3× comes from. Short creative buys attention more efficiently. It doesn't appear to persuade harder.
| Ad length | Site visits (vs. 30s) | Return on ad spend | Purchases (vs. 30s) | Share of ads |
|---|---|---|---|---|
| 15 seconds | +44% | 4.3× | −6% | 26% |
| 30 seconds | baseline | 2.9× | baseline | 64% |
| 31–60 seconds | −33% | 1.6× | about even | 8% |
| Over 60 seconds | −27% | 1.4× | −83% | 2% |
Here's the part that should sting: even with that performance gap, nearly two-thirds of ads on the platform are still 30 seconds, and only a quarter are 15. The majority of advertisers are defaulting to the weaker format, and mostly out of habit rather than a decision about the objective.
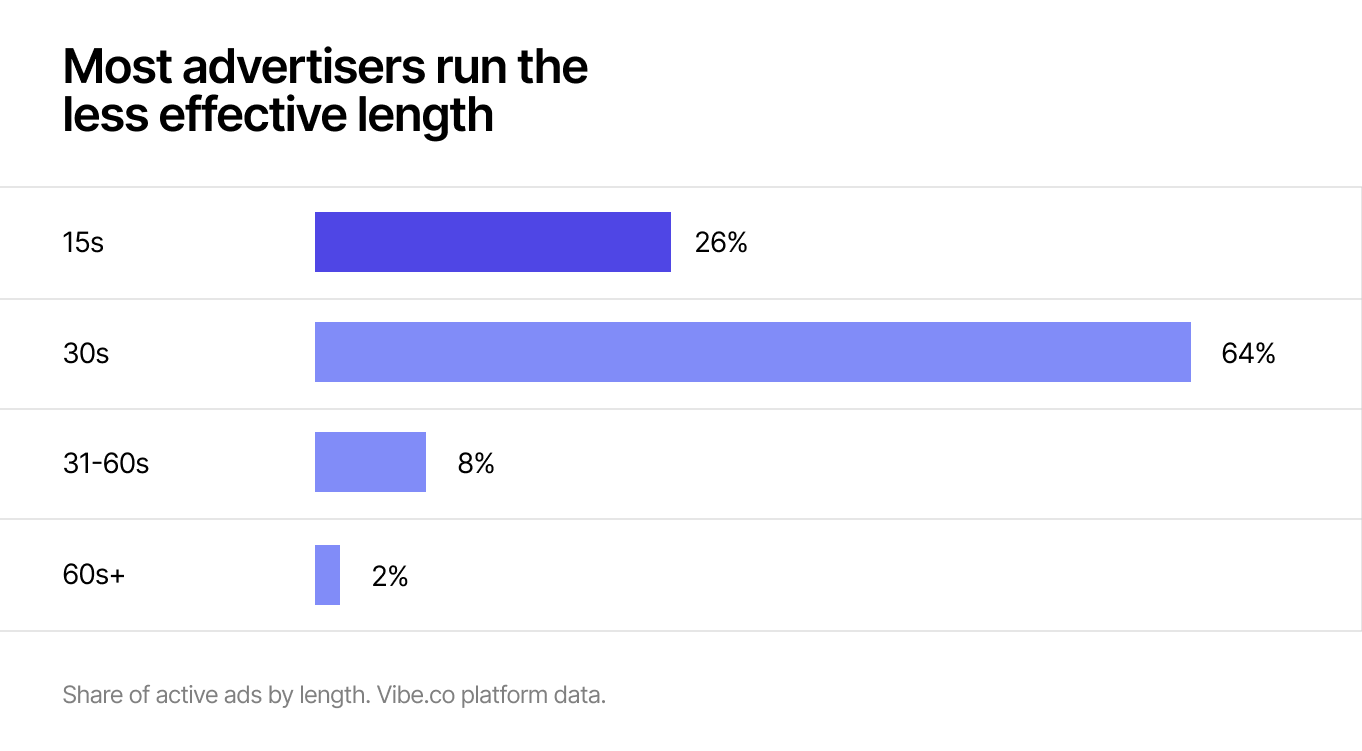
Make 15 seconds your default for reach and traffic, where efficiency is the goal. Move to 30 when the objective is purchase, when the product needs explaining, or when you're running a single creative you can't afford to have underperform. Never run 60-plus for performance objectives.
Win the first three seconds
There is no scroll on streaming. But there is a mental tune-out, and it happens fast. If your opening is a slow, pretty product shot, you've spent your most valuable seconds on a screensaver.
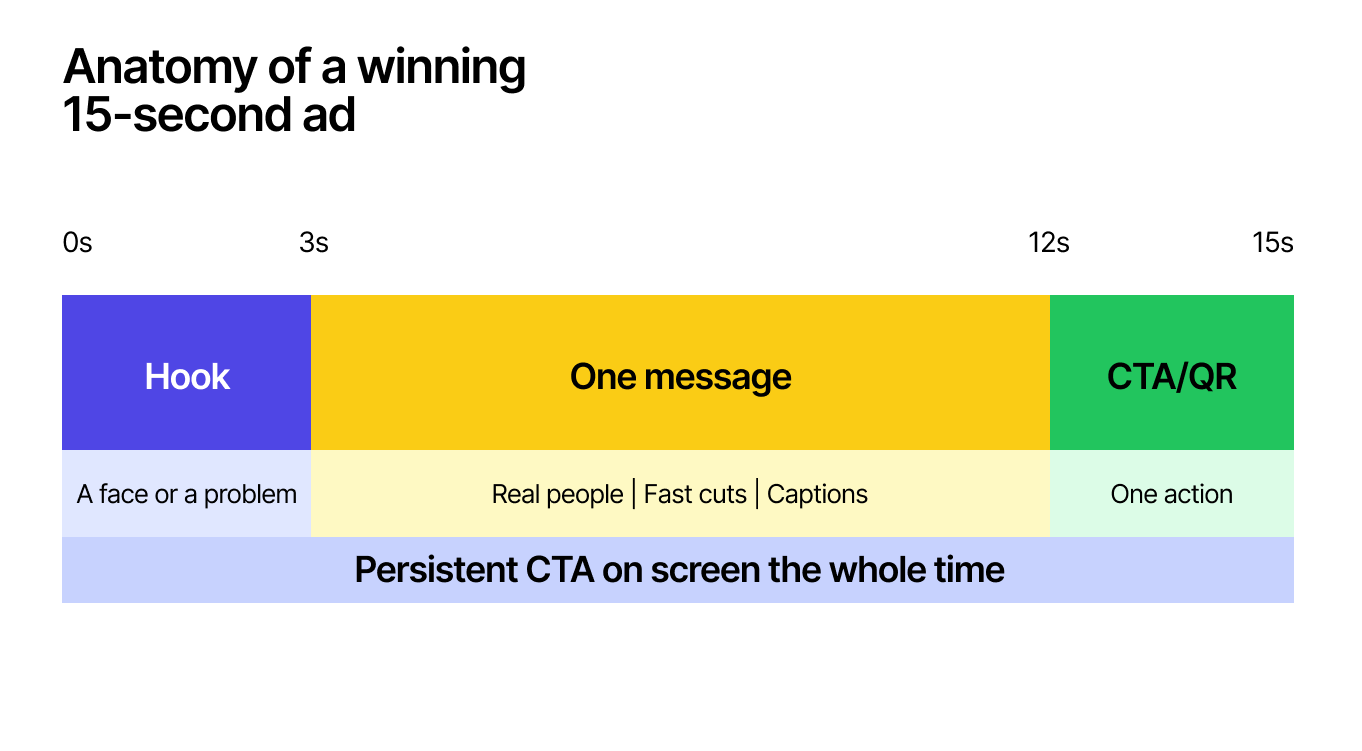
Open on a human face or a sharp problem. Put your brand in the first frames. Keep the edit moving — a good 15-second ad is three or four scenes, not one long take. Then build the entire ad for the way people actually watch: half-paying-attention, in a shared room, with the volume low or off. Your message has to land in the visuals and bold text, not just voiceover. Assume the sound is off and you'll make a better ad than the team that assumes it's on.
Slice, the pizza ordering app, runs through every one of these in 15 seconds. The ad opens on a branded red pizza box — brand in frame zero. Cut to a man with his eyes squeezed shut, phone in hand, screen reading "Wish for Pizza" — a human face and a sharp problem in the first three seconds. The edit never slows down: four scenes in the first eight seconds, each one adding to the problem rather than restating it.
By second eight, a checkout screen shows: Fees: $1,000. The message doesn't arrive in voiceover — it's on screen, large, impossible to miss from across a room. By second thirteen, the resolution: "NO CRAZY FEES!" A viewer half-watching from the couch, phone in hand, volume off, still catches every beat — problem, absurdity, answer — without needing to look up twice. The voiceover is there but the ad doesn't need it.
That ad isn't an outlier. Strip back the top-performing ads on the platform and the same three-beat structure appears every time — a hook that earns attention, a message built to land in a distracted room, and a CTA that is unequivocally clear.
A weak creative doesn't just underperform — it costs you
On our platform, the performance spread between the top quartile of creatives and the bottom quartile is wider than any targeting variable we measure. The best creative isn't a marginal improvement over the worst — it's a different outcome entirely.
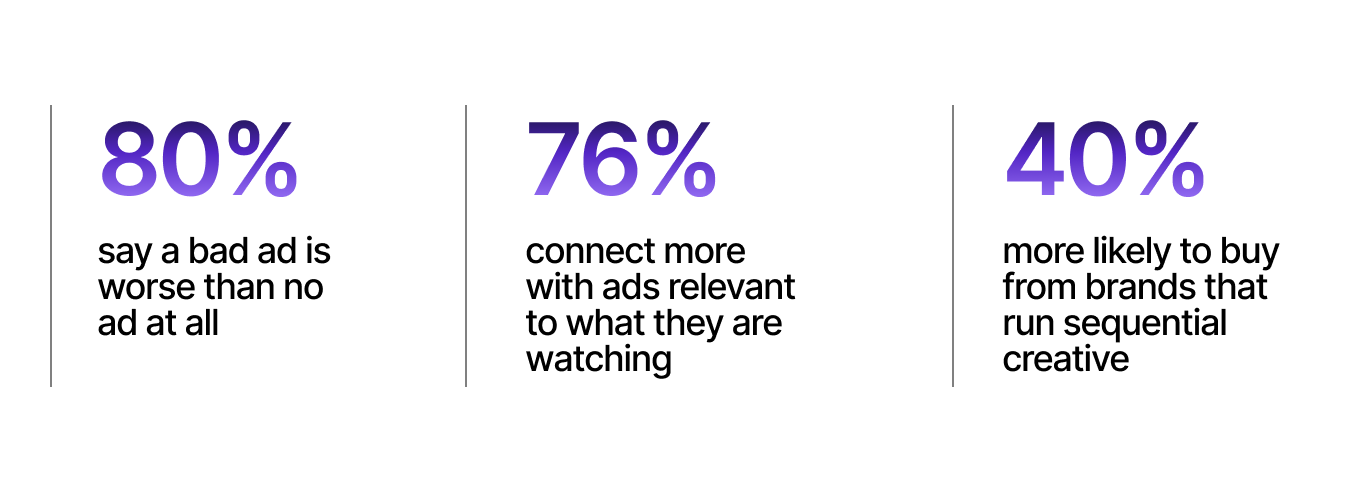
Consumer research tells you why: in Omnicom's Connected Content study, 80% of viewers said a bad ad is worse than no ad at all, and 51% said a bad ad reflects worse on the brand than on the platform that served it. The creative isn't a neutral delivery vehicle. A weak one actively costs you every time it runs.
The flip side is equally real. When the ad fits the moment, viewers lean in: 76% connect more with ads relevant to what they're watching, and 84% connect with ads that feel relatable. Storytelling that builds across exposures pays off — 40% are more likely to buy from brands that run sequential creative rather than seeing the same spot on repeat.
In practice: run a set of connected ads rather than one hero spot shown until everyone's sick of it.
Say one thing, and say it warm
The living room is a distracted, shared environment. Don't ask a viewer to remember three things — ask them to remember one. A single, concrete message outperforms a feature list every time.
A good example is this Bumble ad:
The ad runs through a series of vignettes — a NYE party, a coffee date, a camping trip, and more — each one showing a real couple moment with the kind of specificity that reads as authentic rather than produced. Every scene lands on a yellow card naming that particular start: "it started with NYE," "it started with a new coffee shop," "it started with the great outdoors.” The scenarios change. The message doesn't. By the end of the ad, a viewer who half-watched from across the room has still heard the same thing repeated across every scene: it started with Bumble. That's the principle at work — not a list of features, not a product explanation, one idea delivered in as many ways as the runtime allows.
On tone: decades of effectiveness research point the same way. Positive, emotionally resonant creative builds brands and drives sales better than cold, rational, or fear-led messaging. Fear grabs attention. It rarely converts. Lead warm.
Which message to lead with depends on where the viewer is:
| Angle | Best for | Why it works |
|---|---|---|
| Problem / pain-point | Reaching new audiences | Grabs attention fast — keep the tone from tipping into fear. |
| Educational / how-it-works | New audiences & considered buys | Teaching up front makes everything downstream convert better. |
| Social proof / testimonial | The middle | Real people build trust better than claims. |
| Results / ROI | Lower funnel & B2B | Speaks to the number the buyer is judged on. |
| Urgency / offer | Retargeting & closing | One concrete deal moves warm audiences. |
“When you educate at the top of funnel with CTV, everything downstream converts better — people already understand what we do by the time they hit our site.”
Make the next step effortless
A streaming viewer is on a couch, ten feet from the screen, phone probably in hand. Meet them there. When your CTA appears, make it large enough to read from across the room and clear enough that a viewer who caught only the last five seconds knows exactly what to do.
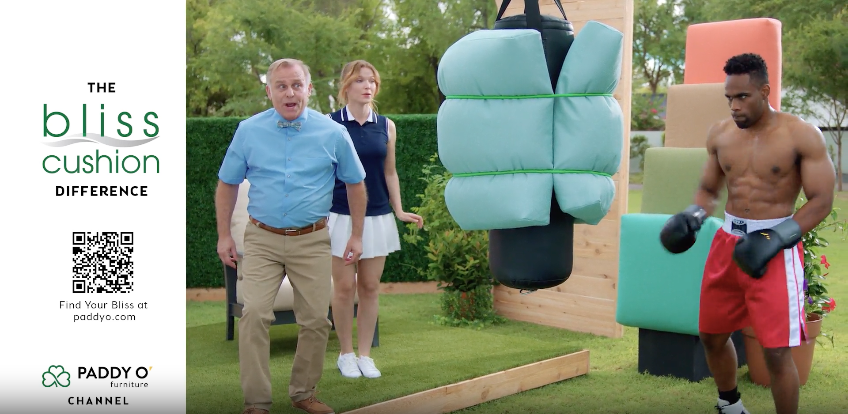
Paddy O' Furniture is a good example. A boxer throws punches at a stack of patio cushions to prove they can take a hit — "The Bliss Cushion Difference" — while a genteel couple looks on in disbelief. The gag carries the entertainment, but the left third of the screen never moves: the brand, a QR code, and "Find Your Bliss at paddyo.com," fixed in frame from start to finish. A viewer who looks up at second three or second thirteen gets the same clear instruction. The CTA isn't waiting for the end of the ad to show up.
The QR code is what makes that instruction effortless. It turns a lean-back moment into a click — no memorizing a URL, no reaching for the remote, no typing it in later. That ease shows up in the numbers: Wispr Flow's QR-focused campaigns on Vibe converted at 20%.
So keep the ask simple. Paddy O' shows a QR code and a URL, but both open the same door — one action, two ways in. That's the bar: pick the single step you want a viewer to take, make it impossible to miss, and don't crowd it with competing asks.
The ads you didn't make are outperforming the ones you did
The instinct is to treat AI-generated creative as the budget option — fast, cheap, and slightly worse. Our data doesn't support that instinct.
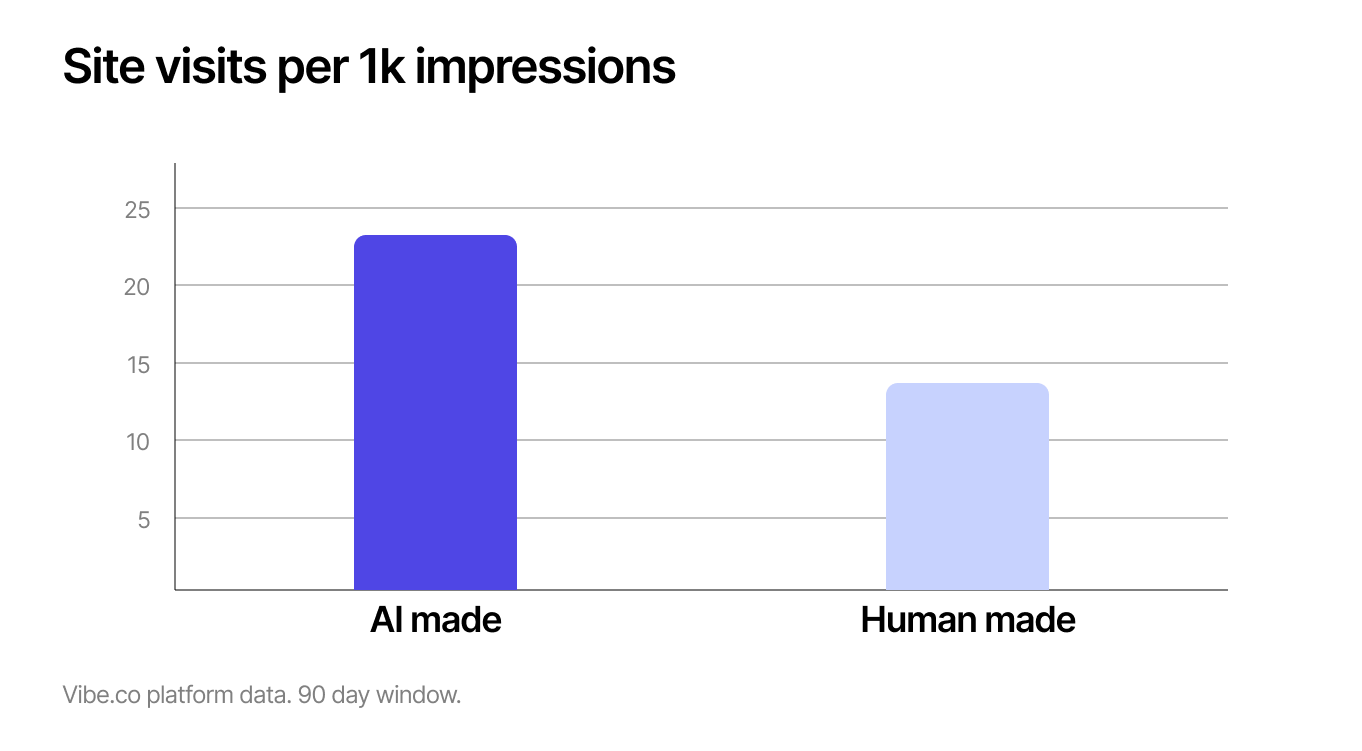
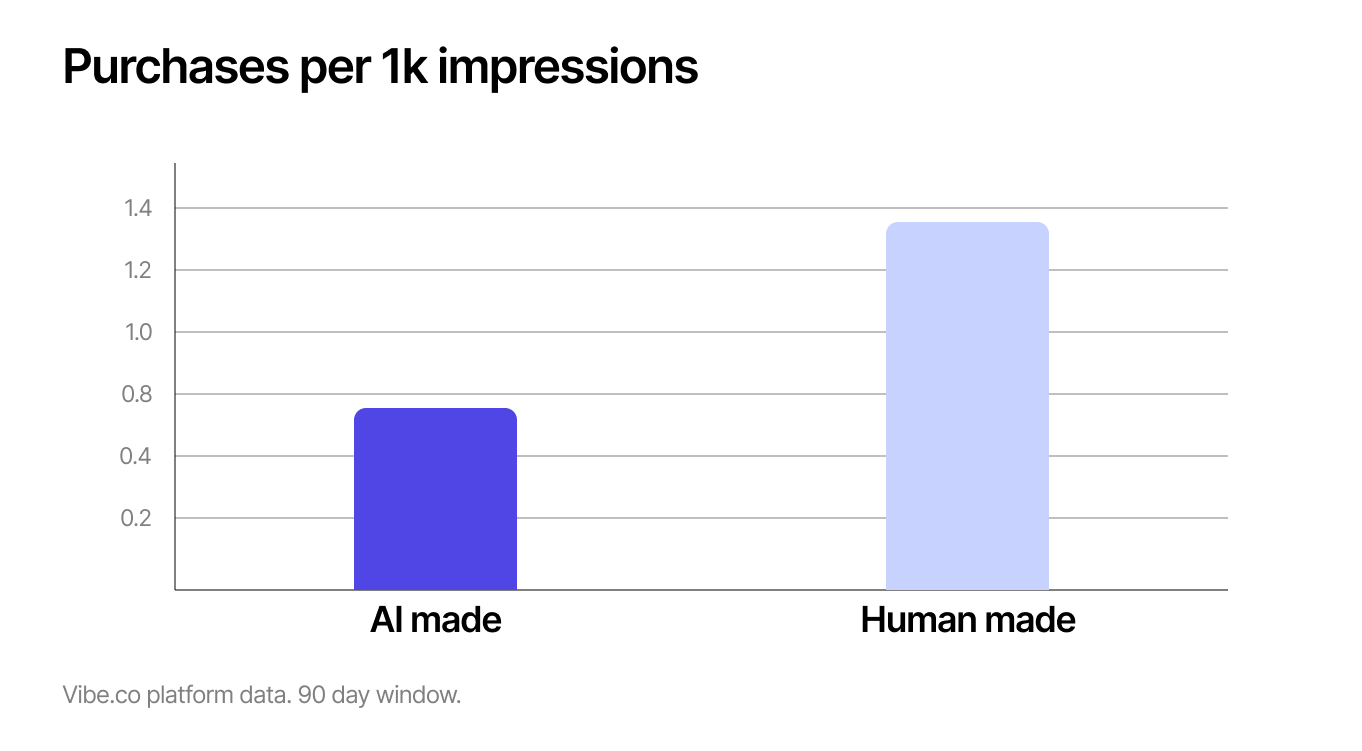
On Vibe over 90 days, AI-made ads drove nearly 62% more site visits per thousand impressions than human-made ads. On direct purchase rate, human-made ads have the edge — 77% more purchases per thousand impressions. That gap is real, and the most likely explanation is compositional: brands using AI creative today are running awareness campaigns, building audiences, not closing conversion funnels. The purchase rate reflects what they were optimizing for. The same compositional caveat applies in the other direction, to the site-visit figure. We haven't isolated AI creative from the advertisers running it, and with 288 flagged creatives the sample is too small to. Treat both numbers as directional, and treat the structural argument below as the actual case.
But the performance comparison is the wrong frame for evaluating AI creative. The case for it is structural.
Traditional creative production runs on a timeline measured in weeks: brief, concept, production, post, delivery. By the time an ad is in market, the campaign data that would have made it better doesn't exist yet. AI collapses that cycle. A brand running on Vibe can launch five variations, see which one is driving visits at day seven, pull the bottom three, and put the budget behind the winner — all before a traditional creative team has finished the first round of revisions.
That speed compounds. Each campaign builds a richer brief for the next one. Which hooks landed. Which openings lost the viewer. Which CTAs converted. The brands running AI creative at volume are accumulating creative intelligence faster than those betting on a single well-produced hero ad — and that gap widens every quarter.
Linda's Electric Quilters, a family-owned online and retail quilting supply business, has run dozens of AI creative variations on Vibe, testing different hooks, openings, and messages against the same audience. It's the model in practice: launch variations, learn what drives visits, use that to sharpen the next one.
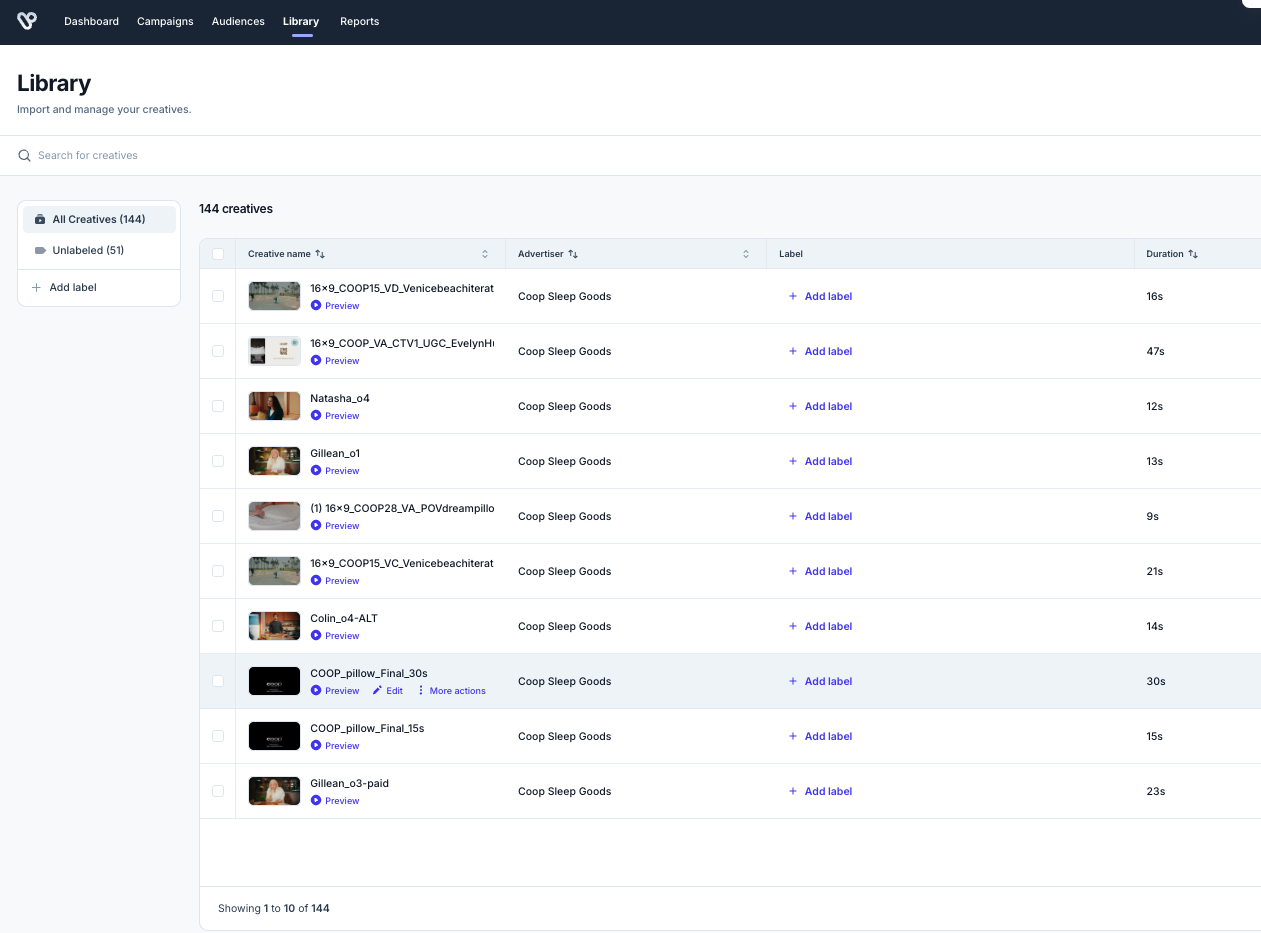
The approach compounds — each test builds a richer brief than the one before it.
AI-generated isn't the only format that enables this. UGC-style creative applies the same logic — lower production barrier, faster iteration, built for a room where someone is half-paying attention rather than fully tuned in.
Batch, a THC gummies brand, runs exactly this format on streaming: a split screen with authentic social video on one side — real people talking through why they switched, text overlays and all — and a clean product panel on the other with a bold offer and a QR code to scan. No studio setup. The UGC footage came from social; the CTV unit wraps it in a direct response frame. The creative earns attention by feeling like content rather than advertising, then converts with a single unmissable ask.
For brands that want visibility into which creative elements are actually driving performance, Vibe's integration with Segwise connects creative analytics directly to campaign results.
There's a personalization dimension too. Running the same ad to a cold audience and a warm retargeting list is a known mistake. AI makes it possible to run tailored variations for each — different hooks, same offer — without a separate production cycle for every segment.
The underlying unlock is not that AI makes better ads. It's that AI makes it possible to find your best ad before your budget runs out, and to keep finding better ones after it does.
The pattern across the winners
Strip away the specifics and the best-performing streaming ads look remarkably alike:
- Short — 15 seconds, built for the goal
- Hooks in three seconds with a face or a problem
- Readable with the sound off
- One message, positive tone
- Relevant and relatable — real people, not stock gloss
- A call-to-action and QR code on screen throughout
- Many versions tested, losers cut fast
The pattern across all of this is consistent: shorter, cleaner, more variations tested harder. The creative gap is real — and on a 65-inch screen where every impression is guaranteed, it's also the most improvable variable in the plan.
There is no single best ad
Everything above bends to context. Fifteen seconds is right for traffic and efficiency; thirty earns its place when you have to explain or drive a purchase. The duration work above is the sharpest example: the same variable points one direction in pooled data and the other direction within a single advertiser, which means "what length should my ad be" has no answer independent of your goal and your baseline. People who’ve already visited your site can take a direct, offer-led message; new audiences need a stronger hook and more teaching.
The winning move isn’t to find the ad — it’s to build the right ad for the goal, the audience, and the moment, and to keep testing into it.
The pattern across all of this is consistent: shorter, cleaner, more variations tested harder. The creative gap is real — and on a 65-inch screen where every impression is guaranteed, it's also the most improvable variable in the plan.
The CTV creative checklist
| Do | Avoid |
|---|---|
| Make 15 seconds your default for reach and traffic; 30 for purchase | Defaulting to 30s out of habit; 60s+ for performance |
| Hook with a face or problem in 3 seconds | Slow, pretty product openings |
| Captions + bold text (sound-off) | Relying on voiceover to carry the message |
| One message, positive tone | Three value props; fear-led framing |
| Relevant, relatable, real people | Stock gloss; the same ad on repeat |
| Test many versions | Betting the budget on one hero ad |
The evidence behind this report
| Finding | Number | Source |
|---|---|---|
| Creative’s share of advertising’s sales impact | 49% | NCSolutions & Nielsen (450+ studies) |
| What marketers assume it is | 19% | NCSolutions & Nielsen |
| 15s vs 30s — site visits | +44% | Vibe platform data |
| A bad ad is worse than no ad | 80% | Omnicom, “Connected Content” (2026) |
| Connect more with content-relevant ads | 76% | Omnicom, “Connected Content” (2026) |
| Likelier to buy with sequential storytelling | 40% | Omnicom, “Connected Content” |
| QR-code ads — conversion rate | 20% | Wispr Flow (Vibe customer) |
| Ad completion rate on CTV | 90–98% | Industry benchmarks |
| 15s→30s effect within a single advertiser | +7% conversion odds | Vibe ML, offline feature study (2026) |
How we measured this
Vibe platform data: approximately 17,000 active ads and 4.9 billion impressions over 90 days. Site visits = tracked web visits attributed after ad exposure; return on ad spend = tracked revenue within 7 days divided by media spend. Ad length from each video's duration metadata. The AI comparison covers approximately 288 AI-flagged creatives across 350 million impressions over 90 days; "AI-generated" marks that the creative was machine-made and does not identify which tool. AI figures are directional.
Independent research: NCSolutions & Nielsen sales-effect meta-analysis; Omnicom Media Group, Connected Content (2026); general CTV completion benchmarks.
Customer results: Wispr Flow published case study.

Streaming TV Targeting Works Like Meta, Not Like Cable
Streaming TV Targeting Works Like Meta, Not Like Cable
Yes, you can do interest-based targeting on streaming TV. Here's how behavioral and interest segments work on CTV and how Vibe stacks them.
Which Advertising Channels to Add in 2026
Most 2026 media plans add a second social channel. The marketers gaining share add a first-screen channel. Here's what's actually worth adding to your mix.
Your CTV Attribution Window Is Probably Set Wrong
The attribution window you configure before launch determines what ROAS gets reported. Here's how to choose the right window for your purchase cycle.
Which CTV Platform Actually Fits a Series B Growth Team?
Series B growth teams are adding CTV. Here's how the main platforms break down — and which one produces results a CFO will actually accept.
Your CTV Pilot Has One Job: Produce a Real Budget Decision. Most Don't.
Run a CTV pilot that answers the question your CFO will ask. How to size it, measure it, and walk out with a number worth acting on.

Get started with Vibe
in minutes.


Industries
© 2026 Vibe, Inc.